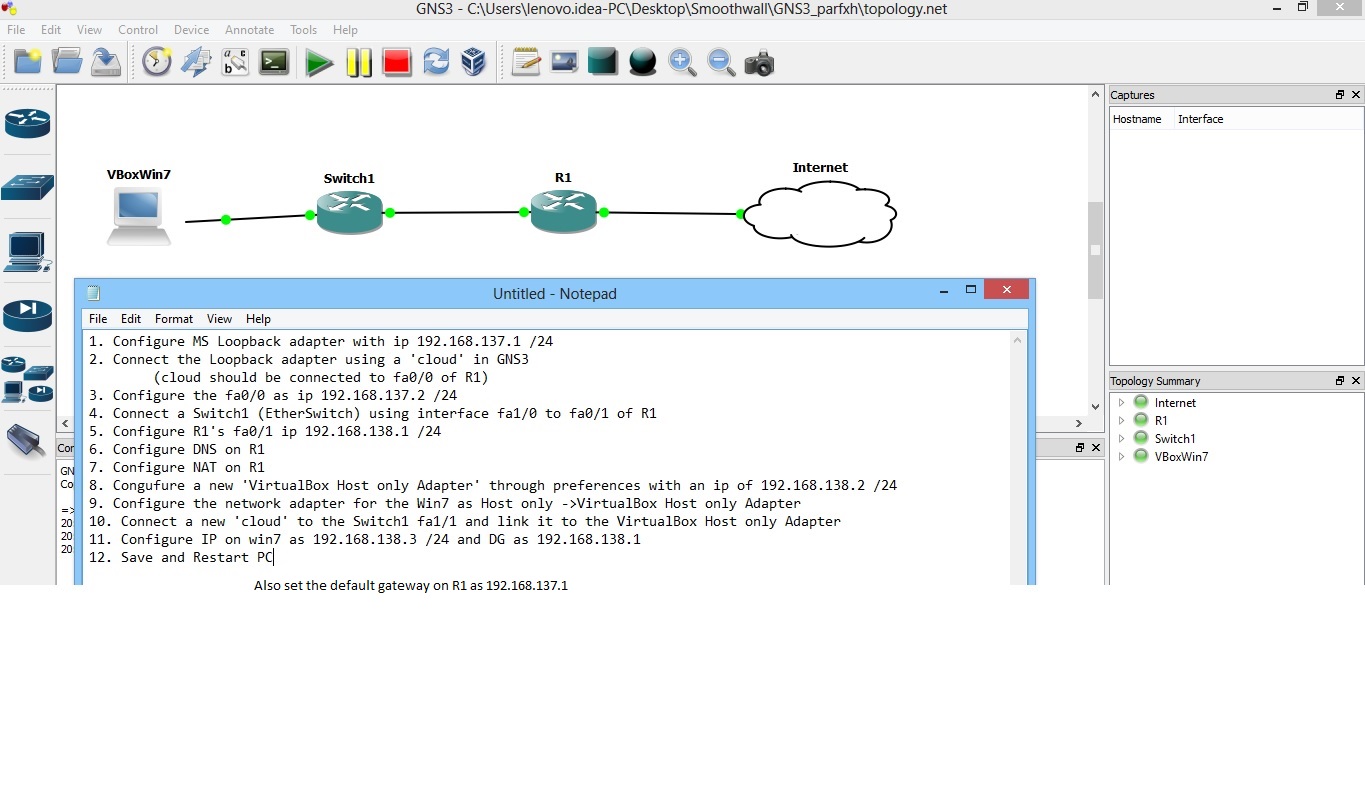
One of the interesting things about GNS3 is that you can connect your topology to the real world. For some of your CCNA and CCNP studies you may need to run an actual Web browser or Cisco’s Security Device Manager (SDM) among others. Just connect your topology to your real PC. You could even connect to virtual machines running on your computer inside VMware or Virtual PC. I’ve even set up two copies of Windows XP Professional running inside VMware virtual machines. Then, I ran Cisco soft IP Phones that could talk to each other. You could connect your virtual network to a real network as well. Connecting a virtual topology running within GNS3 to real devices is very exciting, but again, your throughput is going to be limited compared to using real equipment for the entire topology. It only makes sense to use GNS3 in a lab environment and for learning purposes.
Drag a Cloud into your workspace. Right-click the Cloud and chooseConfigure. Click on C1 under Clouds, but choose the NIO Ethernet tab.Administrator rights are required (root account under Linux).
For Windows users, click on the box directly beneath Generic Ethernet NIO, and choose the network adapter you wish to use. For Linux users, click on the drop-down box to choose your network adapter (either your real adapter or a loopback adapter). Click the Add button and OK. You will need to configure the IP settings for your computer’s adapter, and then use theAdd a link toolbar button to create your connection.
You may use your regular network adapter, but I usually create an MS Loopback adapter to connect to. In Windows, use the Add Hardwarewizard in Control Panel. Choose “Yes, I have already connected the hardware.” On the next screen, choose Add a new hardware device at the end of the list and click Next. Choose to “Install the hardware manually…”and click Next. Choose Network Adapters in the list and click Next. ChooseMicrosoft as the manufacturer and then Microsoft Loopback Adapter as the network adapter. Finish the wizard. Then right-click My Network Places and choose Properties. You may wish to rename the new Local Area Connectionas MS Loopback Adapter. Also, assign the proper IP settings to the adapter in order to connect to your topology. Linux has a built-in loopback adapter already installed.
Now start your router and assign an IP address to the interface that is connected to the Cloud. You should be able to ping from the router to your PC (loopback interface) and the other way around. Don’t forget to deactivate any firewall that could block pings on your computer.
C:\Program Files\Oracle\VirtualBox>VBoxManage.exe modifyvm SW1 –intnet5 N3 (N3 is the name)
Virtualbox supports up to eight network cards. If you look into the *.vbox you will see that there are already preconfigured but disabled. Unfortunately inside the VBox GUI we could only configure up to four. I will show how to get and configure the other.
You have to use VBoxManage to get the other network cards. After the option will always be the NIC Number count one to eight. Here I will use five and the name of the machine that will be configured is “network-test”.
Set Mode and enable NIC
When a Mode is set the NIC will be enabled.
Set NIC five to Host-Only Mode and User vboxnet0 (Initially existing Host-Only Net)
In essence, this method will let you run Mac OS X from inside a program window in Windows. As always, we’re going to use Virtualbox for this. It’s important to note that Windows virtualization programs do not “officially” support Mac OS X, so you will not be able to enable full graphics support. This tutorial should only be taken as a proof of concept.
Computer Requirements
You need a computer with Windows to run Mac OS X on Windows (of course). The “System Type” of your copy of Windows needs to be 64-bit, because OS X Mountain Lion is a 64-bit operating system. If you have a 32-bit copy of Windows, you can only install Mac OS X Snow Leopard on Virtualbox. You will need at least 4 GB of RAM and a dual-core (two core) processor or better. Personally, the computer I was using for this had a 4-core processor and 12 GB RAM, which is way more than enough. You also need about 10 GB of unused hard drive space.
Right click on “My Computer” on your desktop and click “Properties” to check the stats on your computer. If it doesn’t directly tell you how many cores your processor has, look up your processor model on Wikipedia or Google. You also want to find out whether your processor is made by “Intel” or “AMD”. Computers with AMD processors will not work with Mountain Lion.
General Requirements
Virtualbox : This virtualization suite is free, and though it doesn’t offer official support for Mac OS X, it works well enough.
Mountain Lion bootable DVD : Unfortunately, the standard method for installing OS X Mountain Lion on PCs (which uses a paid copy of the Mountain Lion installer) doesn’t work with Virtualbox. Instead, you’ll have to rely on pirated “bootable DVD” copies of Mountain Lion, also known as “distros”. I won’t go into details, but you can download these copies from about any bittorrent website by using a bittorrent client (it’s about 4.5 GB in size). In the past, we’ve used the iAtkos distro for this, but iAtkos hasn’t updated for Mountain Lion yet, so I used the “OS X 10.8 Mountain Lion bootable DVD for Intel PCs”, by Olarila.
Hackboot 1 / Hackboot 2: Even though it’s called a “bootable DVD”, the Olarila version of OS X Mountain Lion still can’t boot in Virtualbox by itself. To help Mountain Lion start, you’ll need to use Olarila’s Hackboot CD. There are three different versions of Hackboot; we’ll need to use two of them in this guide. “Hackboot 1” is for starting the Mountain Lion installer, while “Hackboot” 2 is for starting Mountain Lion itself.
Multibeast 4.6.1: You will need to use Multibeast 4.6.1, our favorite Hackintosh post-installation tool, to set up the Mountain Lion virtual machine after the initial installation. While Multibeast 4.6.1 is an old version designed for Mac OS X Lion instead of Mountain Lion, in our case, it actually works better than newer versions of Multibeast. Registration is required on the tonymacx86 website to download this.
Step 1: Prep
Download Virtualbox, install it, and open it up. Also, if you want to be able to view USB devices from your OS X Mountain Lion virtual machine, download the Virtualbox Extension Pack and run it before going to Step 2.
Step 2: Create a new virtual machine.
Virtualbox lets you run Mac OSX within Windows by creating a virtual machine, which is a program that simulates a normal computer. To create a virtual machine, open up Virtualbox and click “New” on the upper left. Give your new virtual machine a name, and choose “Mac OS X” for the OS Type.
If your version of Virtualbox asks you to choose between 64-bit and 32-bit, be sure to choose 64-bit. Choosing 32-bit will result in a critical “Guru Meditation” error later on.
I recommend assigning 4 GB of RAM to the virtual machine, but you can assign as little as 2 GB of RAM. Every time you turn on Mac OS X, that RAM that you assign here will be used to run the virtual machine. The RAM will be given back to your normal computer after you turn Virtualbox off.
You’ll need to create a new hard disk for the virtual machine. Virtualbox will ask you what type of disk you want to create: VDI, VDMK, or VHD. VDI is the original format for Virtualbox, while VDMK is the format used by VMWare. If you’re considering getting a copy of VMWare, you might want to choose VDMK. Otherwise, just choose VDI. I recommend creating a dynamically expanding disk; the only other option, fixed-size storage, will eat up your hard drive.
Step 3: Give your new virtual machine an operating system.
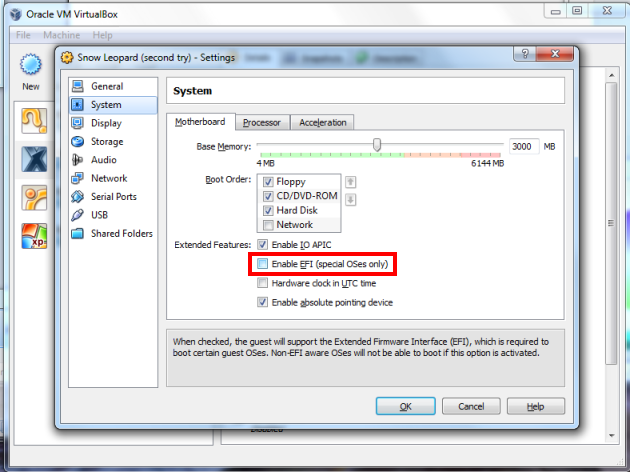
Your virtual machine will now be created. But don’t stop now–you still need to change a few settings before your machine will actually work. Your new virtual machine will show up on the left column of the Virtualbox start page. Select your Mac OS X virtual machine (single-click) from the main page of Virtualbox, and open up the virtual machine settings. Once the settings open up, go to “System” and uncheck the “Enable EFI” box. This is by far the most important single setting that you will need to change.
EFI, which stands for Extended Firmware Interface, is a feature that helps operating systems start up. Unfortunately, Mac OSX requires ‘speshul’ EFI, so the EFI that Virtualbox uses doesn’t work.
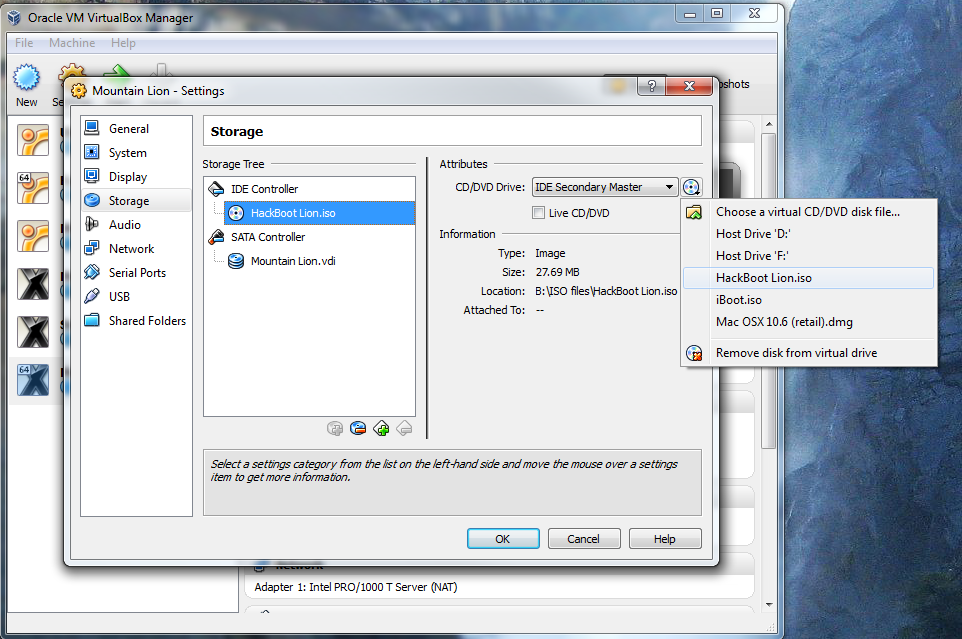
Once you’re done with that, go to the settings for “Storage”. In the storage tree box, you’ll see a CD icon labeled “Empty”. Click on it and click “Choose a virtual CD/DVD disk file”. In the window that pops up, choose the .iso file for Hackboot 1 (download below).
This way, when your virtual machine starts for the first time, it will boot into Hackboot.
Step 4: Install OS X Mountain Lion
Start up your virtual machine. You will come up to the Hackboot boot screen, with a CD icon labeled “HackBoot” in the middle. Don’t do anything yet.
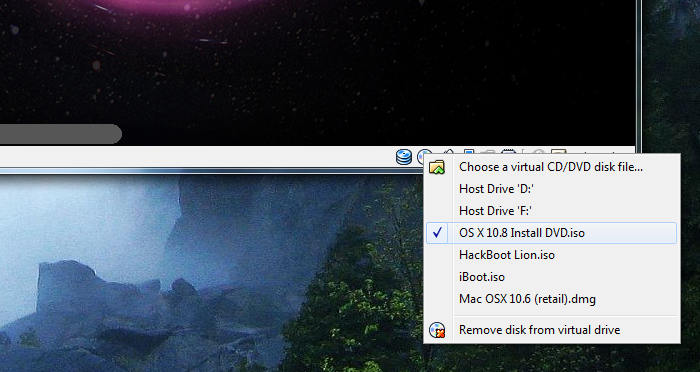
Your mouse cursor will probably be trapped inside the virtual machine. Press the right “Ctrl” key on your keyboard to allow your mouse to escape. Then, at the bottom right of the virtual machine screen, right-click on the little CD icon, and click “Choose a virtual CD/DVD disk file”. A Windows Explorer window will pop up; from there, select the OS X 10.8 Mountain Lion bootable DVD.
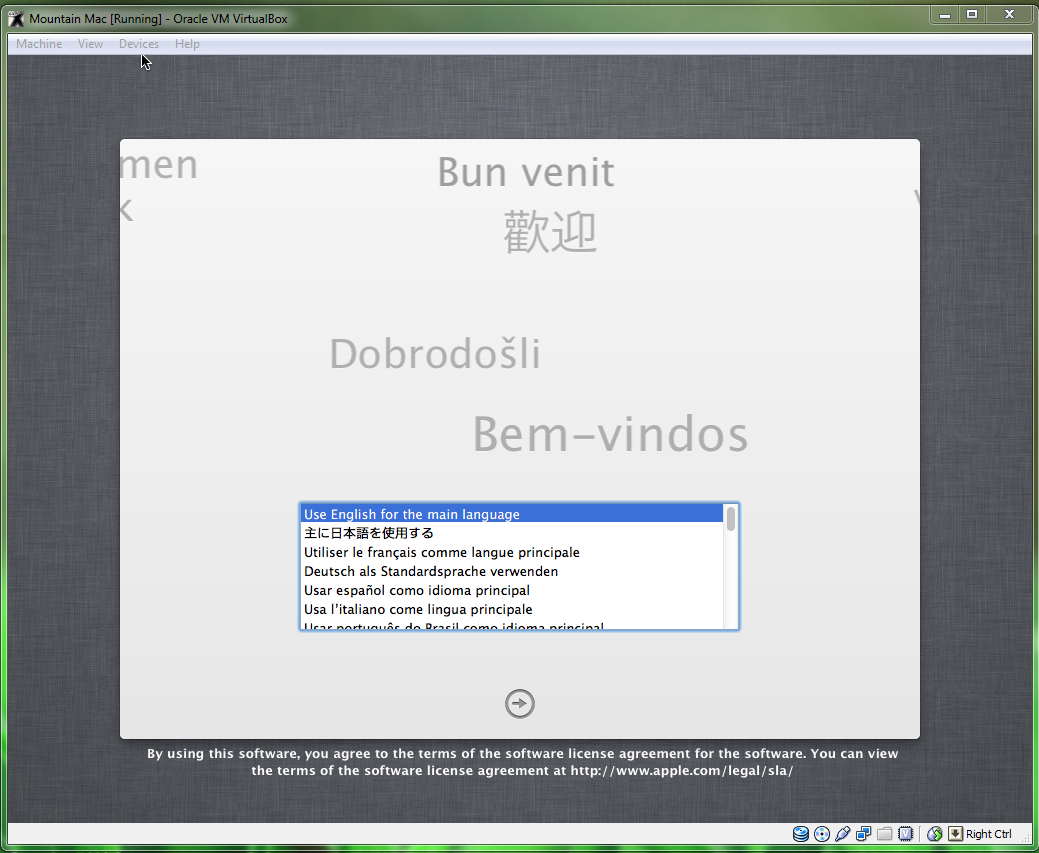
Click back into the Hackboot screen, and press the “F5” key on your keyboard. This will refresh Hackboot. The CD icon in the middle of the Hackboot screen will now say “OS X Install DVD”. Press the enter key on your keyboard. You will then enter the Mac OS X installer page.
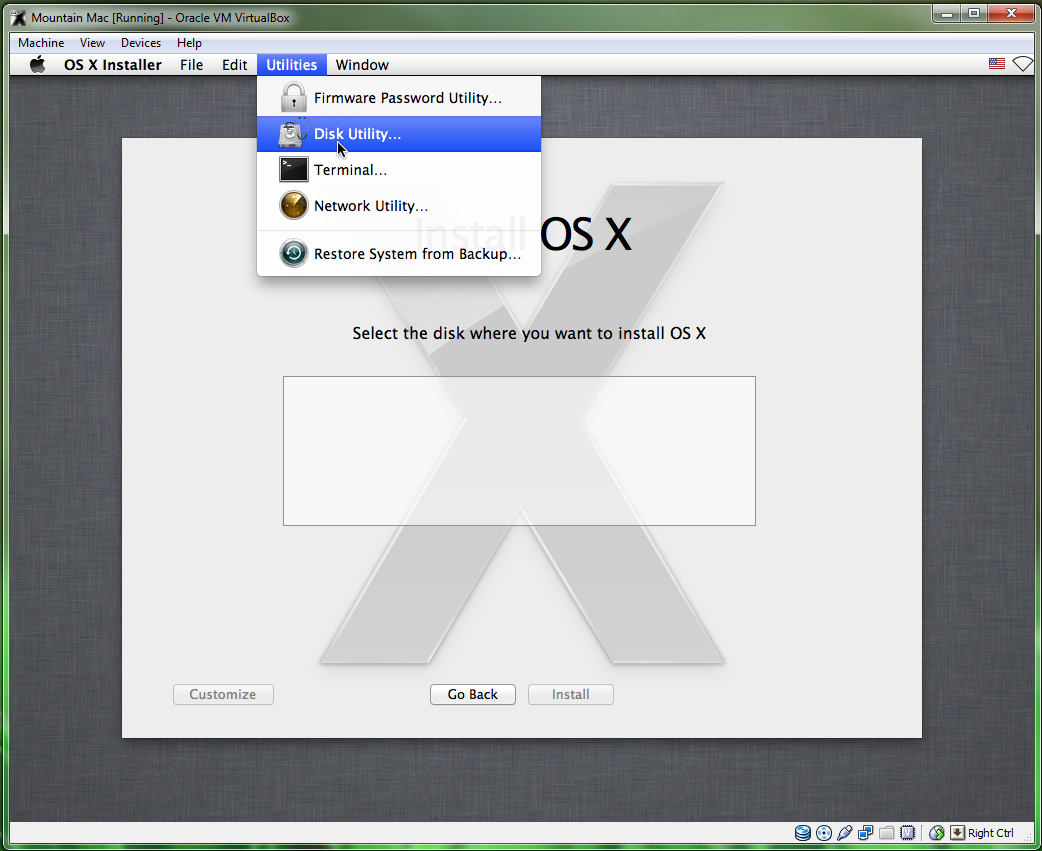
Continue, and you will eventually come up to a page that asks you for a “destination” for your Mac install. Oh no, the page is blank! We’ll have to fix that. To do this, start up Disk Utility (located under the Utilities menu).
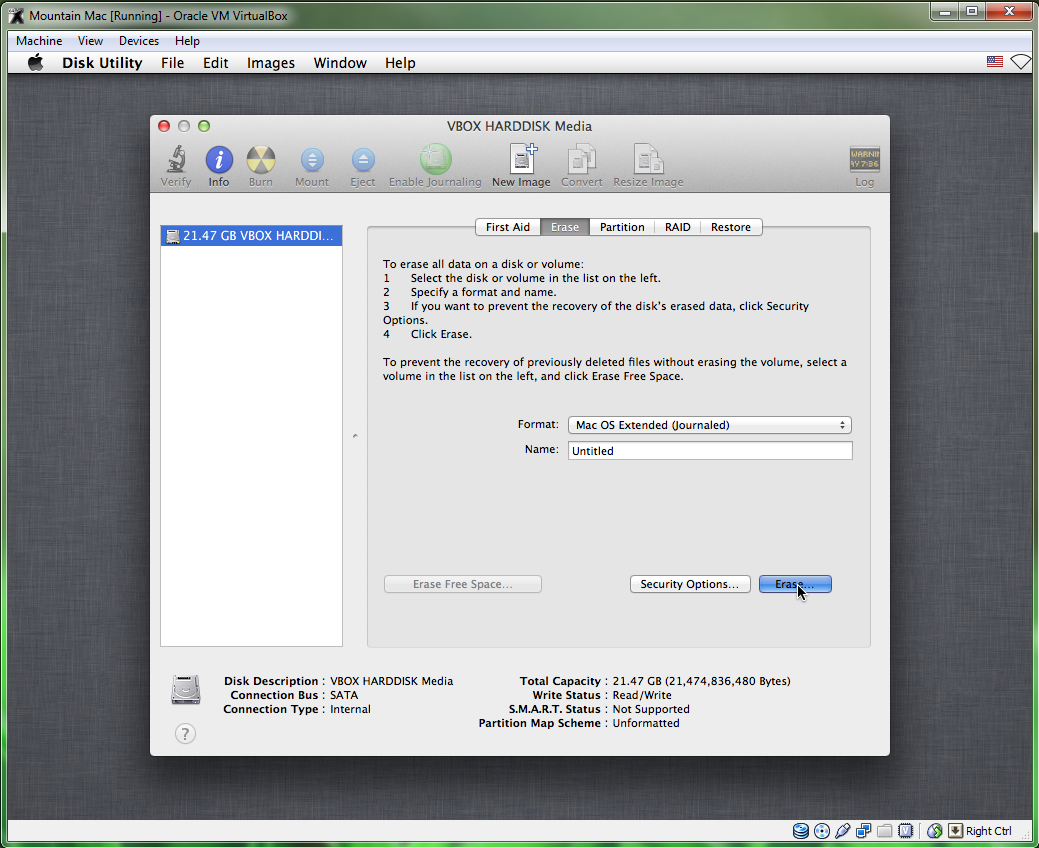
Mac OSX can only be installed on a completely clean disk, so you need to use Disk Utility to wipe your Virtualbox hard disk. Click on the Virtualbox hard disk in Disk Utility and erase it. Don’t worry, there’s nothing important on it.
On the installation page for Mac OSX, the Virtualbox hard disk should now be showing up. Select it and continue.
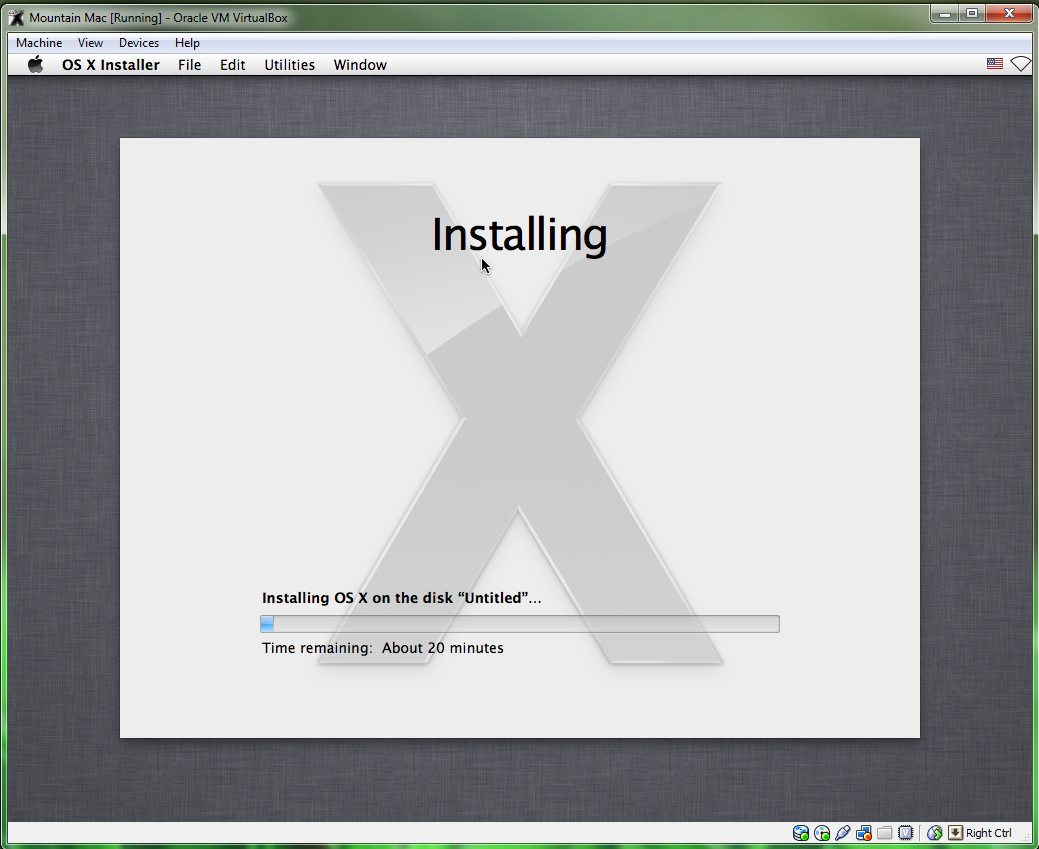
Once that’s done with, Mac OSX will install itself. This will take at least 20 minutes.
When the installation finishes, Mac OS X will crash into a black screen with white text. This is normal; Mac OS X has installed successfully. Now proceed to the next step.
Step 5: Boot it up
Again, press the right Ctrl key to allow your mouse to escape from the virtual machine screen. Then, click on the CD icon in the bottom right of the virtual machine. This time, choose the .iso file for Hackboot 2 (download below).
Restart your virtual machine. You’ll see the Hackboot screen once more, except there will be an icon for your virtual machine’s hard drive in the middle.
Select it (use the arrow keys on your computer) and press “Enter”. Mountain Lion will boot, and you should eventually be led to the Mac OS X setup screen. Fill it out, and you’ll finally be led to the Mac OS X desktop.
This concludes the first part of the guide. However, you’re not done yet! You still have to make your virtual machine bootable without the help of Hackboot.
Step 6: Fix it up
By default, your ethernet (internet) should work in the virtual machine. However, the virtual machine will not have sound, or be able to boot from the hard drive without help. To fix this, open Safari, and download Multibeast 4.6.1. While Multibeast 4.6.1 is an old version designed for Mac OS X Lion instead of Mountain Lion, in our case, it actually works better than newer versions of Multibeast. Registration is required on the tonymacx86 website to download this.
Before starting Multibeast, you have to go the “Security” section of System Preferences in Mac OS X, go to the “General” section, and check “Anywhere” in the “Allow applications” section. Once that’s done, run Multibeast and install the following options (contrary to popular belief, you do not need an actual DSDT file to use UserDSDT).
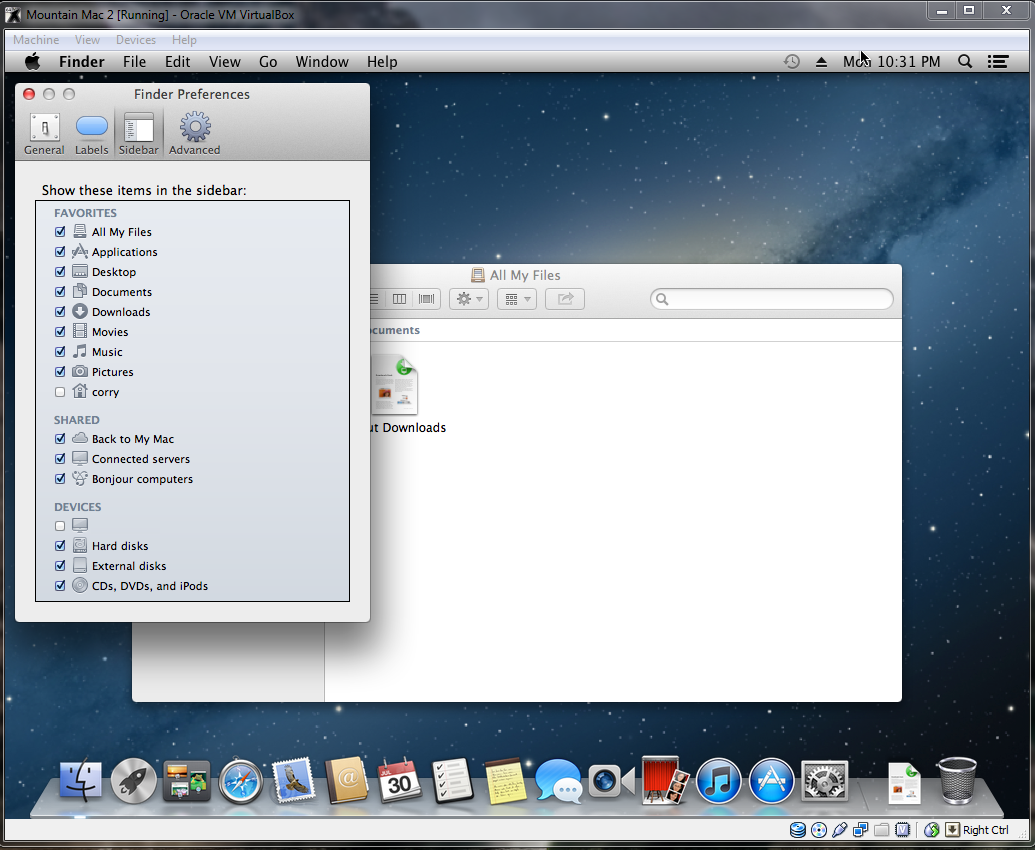
Next, you’ll have to delete a certain kext file in your hard drive that causes boot errors. You can do this from Finder, the file browser built into Mac OS X. However, Finder hides your hard drives in Mountain Lion by default. To unhide them, open Finder, and click on File -> Preferences in the menu bar at the top of Mac OS X. Under the “Sidebar” settings, check “Hard disks”, so that Finder will display your virtual machine’s hard disks in the sidebar.
Then, go to your main hard drive, and go to /System/Library/Extensions. Inside the Extensions folder, delete the file AppleGraphicsControl.kext.
This completes the post-installation process for your virtual machine. Eject the Hackboot CD; you can do this by right-clicking the CD icon at the bottom right of your virtual machine, and unchecking Hackboot. Then, restart your virtual machine. Mac OS X will now be able to boot normally and play audio. Congratulations!
Step 7: Make the screen bigger
Though this step is optional, I still recommend you do it anyways. Anyways, when you first use your Mac OS X, you’ll probably notice one thing: your screen resolution is 1024×768. Since Virtualbox doesn’t “technically” support Mac OS X, there’s no official way to change this. But here’s how you can change it anyways:
Open up Finder and go to the folder “Extra” in the main hard drive, and open the file org.Chameleon.boot.plist. Between <dict> and </dict> in the file, insert the following line.
<key>Graphics Mode</key>
<string>1920x1080x32</string>
You can change “1920x1080x32” to whatever resolution best fits your monitor. For instance, if you want to use the 1600×900 resolution, type in “1600x900x32”. Once you’ve saved it, turn off the virtual machine.
Next, open the Command Prompt in Windows (make sure you are logged into an Administrator account on Windows). You can do this by opening the Start Menu, and typing “command prompt” into the Start Menu search bar. Then, type the following command into the Command Prompt.
cd “C:\Program Files\Oracle\Virtualbox” This command will change the focus of the Command Prompt to the program folder for Virtualbox (if you installed Virtualbox somewhere different, then change the command to wherever you installed it). Next, type in this command:
vboxmanage setextradata “Name of virtual machine” “CustomVideoMode1” “1920x1080x32” This command activates “vboxmanage”, a command-line program included with Virtualbox that allows you to edit the properties of your virtual machine, including its built-in resolutions. Replace “Name of virtual machine” with the name of your virtual machine– you can find the name of your virtual machine in the left pane of the Virtualbox main window (in the screenshot below, my virtual machine is named “Mountain Mac 2”). Replace “1920x1080x32” with whatever resolution you’re using.
Press the enter key to submit the command. Once that’s done, start your virtual machine again. It will now boot in full resolution. Congrats!
Virtual Box for some reason doesn’t seem to show Ubuntu in full screen mode and the display is distorted. You will have to install virtualbox-guest-additions in order to fix this issue.
First, make sure you have the DKMS (Dynamic Kernel Module Support) package.
In a terminal window type:
Code:
sudo apt-get install dkms
Then, install the virtualbox-guest-additions by typing the following apt command in the terminal window:
Code:
sudo apt-get install virtualbox-guest-additions-iso

(to search it first to see if it is available #apt-cache search virtualbox-guest-additions-iso)
Iperf is a tool to measure the bandwidth and the quality of a network link.
The network link is delimited by two hosts running Iperf.
The quality of a link can be tested as follows:
– Latency (response time or RTT): can be measured with the Ping command.
– Jitter (latency variation): can be measured with an Iperf UDP test.
– Datagram loss: can be measured with an Iperf UDP test.
The bandwidth is measured through TCP tests.
To be clear, the difference between TCP (Transmission Control Protocol) and UDP (User Datagram Protocol) is that TCP use processes to check that the packets are correctly sent to the receiver whereas with UDP the packets are sent without any checks but with the advantage of being quicker than TCP.
Iperf uses the different capacities of TCP and UDP to provide statistics about network links.
Finally, Iperf can be installed very easily on any UNIX/Linux or Microsoft Windows system. One host must be set as client, the other one as server.
Here is a diagram where Iperf is installed on a Linux and Microsoft Windows machine.
Linux is used as the Iperf client and Windows as the Iperf server. Of course, it is also possible to use two Linux boxes.
Port, timing and interval
UDP tests, bandwidth settings
Maximum Segment Size display
Maximum Segment Size settings
Parallel tests
help
By default, the Iperf client connects to the Iperf server on the TCP port 5001 and the bandwidth displayed by Iperf is the bandwidth from the client to the server.
If you want to use UDP tests, use the -u argument.
The -d and -r Iperf client arguments measure the bi-directional bandwidths. (See further on this tutorial)
Client side:
#iperf -c 10.1.1.1
————————————————————
Client connecting to 10.1.1.1, TCP port 5001
TCP window size: 16384 Byte (default)
————————————————————
[ 3] local 10.6.2.5 port 33453 connected with 10.1.1.1 port 5001
[ 3] 0.0-10.2 sec 1.26 MBytes 1.05 Mbits/sec
Server side:
#iperf -s
————————————————————
Server listening on TCP port 5001
TCP window size: 8.00 KByte (default)
————————————————————
[852] local 10.1.1.1 port 5001 connected with 10.6.2.5 port 33453
[ ID] Interval Transfer Bandwidth
[852] 0.0-10.6 sec 1.26 MBytes 1.03 Mbits/sec
Data formatting: (-f argument)
The -f argument can display the results in the desired format: bits(b), bytes(B), kilobits(k), kilobytes(K), megabits(m), megabytes(M), gigabits(g) or gigabytes(G).
Generally the bandwidth measures are displayed in bits (or Kilobits, etc …) and an amount of data is displayed in bytes (or Kilobytes, etc …).
As a reminder, 1 byte is equal to 8 bits and, in the computer science world, 1 kilo is equal to 1024 (2^10).
For example: 100’000’000 bytes is not equal to 100 Mbytes but to 100’000’000/1024/1024 = 95.37 Mbytes.
Client side:
#iperf -c 10.1.1.1 -f b
————————————————————
Client connecting to 10.1.1.1, TCP port 5001
TCP window size: 16384 Byte (default)
————————————————————
[ 3] local 10.6.2.5 port 54953 connected with 10.1.1.1 port 5001
[ 3] 0.0-10.2 sec 1359872 Bytes 1064272 bits/sec
Server side:
#iperf -s
————————————————————
Server listening on TCP port 5001
TCP window size: 8.00 KByte (default)
————————————————————
[852] local 10.1.1.1 port 5001 connected with 10.6.2.5 port 33453
[ ID] Interval Transfer Bandwidth
[852] 0.0-10.6 sec 920 KBytes 711 Kbits/sec
The Iperf server connects back to the client allowing the bi-directional bandwidth measurement. By default, only the bandwidth from the client to the server is measured.
If you want to measure the bi-directional bandwidth simultaneously, use the -d keyword. (See next test.)
Client side:
#iperf -c 10.1.1.1 -r
————————————————————
Server listening on TCP port 5001
TCP window size: 85.3 KByte (default)
————————————————————
————————————————————
Client connecting to 10.1.1.1, TCP port 5001
TCP window size: 16.0 KByte (default)
————————————————————
[ 5] local 10.6.2.5 port 35726 connected with 10.1.1.1 port 5001
[ 5] 0.0-10.0 sec 1.12 MBytes 936 Kbits/sec
[ 4] local 10.6.2.5 port 5001 connected with 10.1.1.1 port 1640
[ 4] 0.0-10.1 sec 74.2 MBytes 61.7 Mbits/sec
Server side:
#iperf -s
————————————————————
Server listening on TCP port 5001
TCP window size: 8.00 KByte (default)
————————————————————
[852] local 10.1.1.1 port 5001 connected with 10.6.2.5 port 54355
[ ID] Interval Transfer Bandwidth
[852] 0.0-10.1 sec 1.15 MBytes 956 Kbits/sec
————————————————————
Client connecting to 10.6.2.5, TCP port 5001
TCP window size: 8.00 KByte (default)
————————————————————
[824] local 10.1.1.1 port 1646 connected with 10.6.2.5 port 5001
[ ID] Interval Transfer Bandwidth
[824] 0.0-10.0 sec 73.3 MBytes 61.4 Mbits/sec
Simultaneous bi-directional bandwidth measurement: (-d argument)
Also check the “Jperf” section.
To measure the bi-directional bandwidths simultaneousely, use the -d argument. If you want to test the bandwidths sequentially, use the -r argument (see previous test).
By default (ie: without the -r or -d arguments), only the bandwidth from the client to the server is measured.
Client side:
#iperf -c 10.1.1.1 -d
————————————————————
Server listening on TCP port 5001
TCP window size: 85.3 KByte (default)
————————————————————
————————————————————
Client connecting to 10.1.1.1, TCP port 5001
TCP window size: 16.0 KByte (default)
————————————————————
[ 5] local 10.6.2.5 port 60270 connected with 10.1.1.1 port 5001
[ 4] local 10.6.2.5 port 5001 connected with 10.1.1.1 port 2643
[ 4] 0.0-10.0 sec 76.3 MBytes 63.9 Mbits/sec
[ 5] 0.0-10.1 sec 1.55 MBytes 1.29 Mbits/sec
Server side:
#iperf -s
————————————————————
Server listening on TCP port 5001
TCP window size: 8.00 KByte (default)
————————————————————
[852] local 10.1.1.1 port 5001 connected with 10.6.2.5 port 60270
————————————————————
Client connecting to 10.6.2.5, TCP port 5001
TCP window size: 8.00 KByte (default)
————————————————————
[800] local 10.1.1.1 port 2643 connected with 10.6.2.5 port 5001
[ ID] Interval Transfer Bandwidth
[800] 0.0-10.0 sec 76.3 MBytes 63.9 Mbits/sec
[852] 0.0-10.1 sec 1.55 MBytes 1.29 Mbits/sec
TCP Window size: (-w argument)
The TCP window size is the amount of data that can be buffered during a connection without a validation from the receiver.
It can be between 2 and 65,535 bytes.
On Linux systems, when specifying a TCP buffer size with the -w argument, the kernel allocates double as much as indicated.
Client side:
#iperf -c 10.1.1.1 -w 2000
WARNING: TCP window size set to 2000 bytes. A small window size
will give poor performance. See the Iperf documentation.
————————————————————
Client connecting to 10.1.1.1, TCP port 5001
TCP window size: 3.91 KByte (WARNING: requested 1.95 KByte)
————————————————————
[ 3] local 10.6.2.5 port 51400 connected with 10.1.1.1 port 5001
[ 3] 0.0-10.1 sec 704 KBytes 572 Kbits/sec
Server side:
#iperf -s -w 4000
————————————————————
Server listening on TCP port 5001
TCP window size: 3.91 KByte
————————————————————
[852] local 10.1.1.1 port 5001 connected with 10.6.2.5 port 51400
[ ID] Interval Transfer Bandwidth
[852] 0.0-10.1 sec 704 KBytes 570 Kbits/sec
Communication port (-p), timing (-t) and interval (-i):
The Iperf server communication port can be changed with the -p argument. It must be configured on the client and the server with the same value, default is TCP port 5001.
The -t argument specifies the test duration time in seconds, default is 10 secs.
The -i argument indicates the interval in seconds between periodic bandwidth reports.
————————————————————
Server listening on TCP port 12000
TCP window size: 8.00 KByte (default)
————————————————————
[852] local 10.1.1.1 port 12000 connected with 10.6.2.5 port 58316
[ ID] Interval Transfer Bandwidth
[852] 0.0-20.1 sec 3.00 MBytes 1.25 Mbits/sec
UDP tests: (-u), bandwidth settings (-b)
Also check the “Jperf” section.
The UDP tests with the -u argument will give invaluable information about the jitter and the packet loss. If you don’t specify the -u argument, Iperf uses TCP.
To keep a good link quality, the packet loss should not go over 1 %. A high packet loss rate will generate a lot of TCP segment retransmissions which will affect the bandwidth.
The jitter is basically the latency variation and does not depend on the latency. You can have high response times and a very low jitter. The jitter value is particularly important on network links supporting voice over IP (VoIP) because a high jitter can break a call.
The -b argument allows the allocation if the desired bandwidth.
Client side:
#iperf -c 10.1.1.1 -u -b 10m
————————————————————
Client connecting to 10.1.1.1, UDP port 5001
Sending 1470 byte datagrams
UDP buffer size: 108 KByte (default)
————————————————————
[ 3] local 10.6.2.5 port 32781 connected with 10.1.1.1 port 5001
[ 3] 0.0-10.0 sec 11.8 MBytes 9.89 Mbits/sec
[ 3] Sent 8409 datagrams
[ 3] Server Report:
[ 3] 0.0-10.0 sec 11.8 MBytes 9.86 Mbits/sec 2.617 ms 9/ 8409 (0.11%)
Server side:
#iperf -s -u -i 1
————————————————————
Server listening on UDP port 5001
Receiving 1470 byte datagrams
UDP buffer size: 8.00 KByte (default)
————————————————————
[904] local 10.1.1.1 port 5001 connected with 10.6.2.5 port 32781
[ ID] Interval Transfer Bandwidth Jitter Lost/Total Datagrams
[904] 0.0- 1.0 sec 1.17 MBytes 9.84 Mbits/sec 1.830 ms 0/ 837 (0%)
[904] 1.0- 2.0 sec 1.18 MBytes 9.94 Mbits/sec 1.846 ms 5/ 850 (0.59%)
[904] 2.0- 3.0 sec 1.19 MBytes 9.98 Mbits/sec 1.802 ms 2/ 851 (0.24%)
[904] 3.0- 4.0 sec 1.19 MBytes 10.0 Mbits/sec 1.830 ms 0/ 850 (0%)
[904] 4.0- 5.0 sec 1.19 MBytes 9.98 Mbits/sec 1.846 ms 1/ 850 (0.12%)
[904] 5.0- 6.0 sec 1.19 MBytes 10.0 Mbits/sec 1.806 ms 0/ 851 (0%)
[904] 6.0- 7.0 sec 1.06 MBytes 8.87 Mbits/sec 1.803 ms 1/ 755 (0.13%)
[904] 7.0- 8.0 sec 1.19 MBytes 10.0 Mbits/sec 1.831 ms 0/ 850 (0%)
[904] 8.0- 9.0 sec 1.19 MBytes 10.0 Mbits/sec 1.841 ms 0/ 850 (0%)
[904] 9.0-10.0 sec 1.19 MBytes 10.0 Mbits/sec 1.801 ms 0/ 851 (0%)
[904] 0.0-10.0 sec 11.8 MBytes 9.86 Mbits/sec2.618 ms 9/ 8409 (0.11%)
Maximum Segment Size (-m argument) display:
The Maximum Segment Size (MSS) is the largest amount of data, in bytes, that a computer can support in a single, unfragmented TCP segment.
It can be calculated as follows:
MSS = MTU – TCP & IP headers
The TCP & IP headers are equal to 40 bytes.
The MTU or Maximum Transmission Unit is the greatest amount of data that can be transferred in a frame.
Here are some default MTU size for different network topology:
Ethernet – 1500 bytes: used in a LAN.
PPPoE – 1492 bytes: used on ADSL links.
Token Ring (16Mb/sec) – 17914 bytes: old technology developed by IBM.
Dial-up – 576 bytes
Generally, a higher MTU (and MSS) brings higher bandwidth efficiency
Client side:
#iperf -c 10.1.1.1 -m
————————————————————
Client connecting to 10.1.1.1, TCP port 5001
TCP window size: 16.0 KByte (default)
————————————————————
[ 3] local 10.6.2.5 port 41532 connected with 10.1.1.1 port 5001
[ 3] 0.0-10.2 sec 1.27 MBytes 1.04 Mbits/sec
[ 3] MSS size 1448 bytes (MTU 1500 bytes, ethernet)
Here the MSS is not equal to 1500 – 40 but to 1500 – 40 – 12 (Timestamps option) = 1448
Server side:
#iperf -s
Maximum Segment Size (-M argument) settings:
Use the -M argument to change the MSS. (See the previous test for more explanations about the MSS)
#iperf -c 10.1.1.1 -M 1300 -m
WARNING: attempt to set TCP maximum segment size to 1300, but got 536
————————————————————
Client connecting to 10.1.1.1, TCP port 5001
TCP window size: 16.0 KByte (default)
————————————————————
[ 3] local 10.6.2.5 port 41533 connected with 10.1.1.1 port 5001
[ 3] 0.0-10.1 sec 4.29 MBytes 3.58 Mbits/sec
[ 3] MSS size 1288 bytes (MTU 1328 bytes, unknown interface)
Server side:
#iperf -s
Parallel tests (-P argument):
Use the -P argument to run parallel tests.
Client side:
#iperf -c 10.1.1.1 -P 2
————————————————————
Client connecting to 10.1.1.1, TCP port 5001
TCP window size: 16.0 KByte (default)
————————————————————
[ 3] local 10.6.2.5 port 41534 connected with 10.1.1.1 port 5001
[ 4] local 10.6.2.5 port 41535 connected with 10.1.1.1 port 5001
[ 4] 0.0-10.1 sec 1.35 MBytes 1.12 Mbits/sec
[ 3] 0.0-10.1 sec 1.35 MBytes 1.12 Mbits/sec [SUM] 0.0-10.1 sec 2.70 MBytes 2.24 Mbits/sec
Iperf is a neat little tool with the simple goal of helping administrators measure the performance of their network. Worthy of mention is the fact that it can measure both TCP and UDP performance on a network. Iperf is cross platform software and open source.
We will be making use of the command line, do not fear the command line Iperf is a simple tool to use.
Say I want to test the available bandwidth between a server(Windows Server 2008) and a client workstation(Windows 7). Iperf will try to move as much data as possible using the available link in order to conduct the test.
Instructions
Download the Iperf executable and place the file on any directory you wish, my web browser(Firefox) places all downloaded files on the Download directory which is where I will be executing Iperf from.
Note:You will need to open port 5001 on the Iperf server.
Server Setup
Go to Start > All Programs > Accessories > Command Prompt
With the command line prompt open type
cd Dowloads
or the location where the Iperf executable resides.
Now that you are in the same directory as Iperf type
iperf -s
to start the Iperf server. If you look at the screen Iperf listens on port 5001 you may have to open port 5001 on your firewall.
Client Set Up
Imitating the steps above execute Iperf in the same manner, but this time we are going to give the Iperf client different instructions. On the Iperf client command line type
iperf -c 192.168.1.51
. This will be our client and we are telling Iperf the server is located at 192.168.1.51.
Give Iperf some time to test the connection, after the test is done Iperf will present the results.
The results are easy to understand in this case Iperf managed to transfer 113 Mbytes at 94.5 Mbit/s, the results will changed when used on a busy network which is where Iperf will reveal the amount of available bandwidth in the network.
The m option displays all data in MBs. The total os 7976 MB is the total amount of RAM installed on the system, that is 8GB. The used column shows the amount of RAM that has been used by linux, in this case around 6.4 GB. The output is pretty self explanatory. The catch over here is the cached and buffers column. The second line tells that 4.6 GB is free. This is the free memory in first line added with the buffers and cached amount of memory.
Linux has the habit of caching lots of things for faster performance, so that memory can be freed and used if needed.
The last line is the swap memory, which in this case is lying entirely free.
2. /proc/meminfo
The next way to check memory usage is to read the /proc/meminfo file. Know that the /proc file system does not contain real files. They are rather virtual files that contain dynamic information about the kernel and the system.
Check the values of MemTotal, MemFree, Buffers, Cached, SwapTotal, SwapFree.
They indicate same values of memory usage as the free command.
3. vmstat
The vmstat command with the s option, lays out the memory usage statistics much like the proc command. Here is an example
$ vmstat -s
      8167848 K total memory
      7449376 K used memory
      3423872 K active memory
      3140312 K inactive memory
       718472 K free memory
      1154464 K buffer memory
      2422876 K swap cache
      1998844 K total swap
            0 K used swap
      1998844 K free swap
       392650 non-nice user cpu ticks
         8073 nice user cpu ticks
        83959 system cpu ticks
     10448341 idle cpu ticks
        91904 IO-wait cpu ticks
            0 IRQ cpu ticks
         2189 softirq cpu ticks
            0 stolen cpu ticks
      2042603 pages paged in
      2614057 pages paged out
            0 pages swapped in
            0 pages swapped out
     42301605 interrupts
     94581566 CPU context switches
   1382755972 boot time
         8567 forks
$
The top few lines indicate total memory, free memory etc and so on.
4. top command
The top command is generally used to check memory and cpu usage per process. However it also reports total memory usage and can be used to monitor the total RAM usage. The header on output has the required information. Here is a sample output
Check the KiB Mem and KiB Swap lines on the header. They indicate total, used and free amounts of the memory. The buffer and cache information is present here too, like the free command.
5. htop
Similar to the top command, the htop command also shows memory usage along with various other details.
The header on top shows cpu usage along with RAM and swap usage with the corresponding figures.
In computer networks, a reverse proxy is a type of proxy server that retrieves resources on behalf of a client from one or moreservers. These resources are then returned to the client as though they originated from the server itself (or servers themselves).While a forward proxy acts as an intermediary for its (usually nearby) associated clients and returns to them resources accessible on the Internet, a reverse proxy acts as an intermediary for its (usually nearby) associated servers and only returns resources provided by those associated servers.
A forward proxy taking requests from an internal network and forwarding them to the Internet.
An open proxy forwarding requests from and to anywhere on the Internet.
A reverse proxy taking requests from the Internet and forwarding them to servers in an internal network. Those making requests connect to the proxy and may not be aware of the internal network.
Reverse Proxies broker connections coming from the internet, to your app servers. Forward Proxies filter connections going out to the internet, from clients sitting behind the firewall.
Reverse Proxies take origin connections from the internet and connect them to one server or a server farm, meaning multiple inbound connections from the internet are pooled into one or more connections to the server(s). This is known as TCP Multiplexing, and is often used with Load Balancing techniques to optimize and accelerate application delivery. Reverse Proxies measure load based on the incoming and outgoing connection ratio, the higher the ratio the better the performance
Reverse Proxies are good for:
Application Delivery including:
Load Balancing (TCP Multiplexing)
SSL Offload/Acceleration (SSL Multiplexing)
Caching
Compression
Content Switching/Redirection
Application Firewall
Server Obfuscation
Authentication
Single Sign On
Reverse proxies can hide the existence and characteristics of an origin server or servers.
Application firewall features can protect against common web-based attacks. Without a reverse proxy, removing malware or initiating takedowns, for example, can become difficult.
A reverse proxy can distribute the load from incoming requests to several servers, with each server serving its own application area. In the case of reverse proxying in the neighborhood of web servers, the reverse proxy may have to rewrite the URL in each incoming request in order to match the relevant internal location of the requested resource.
A reverse proxy can reduce load on its origin servers by cachingstatic content, as well as dynamic content – also known as web acceleration. Proxy caches of this sort can often satisfy a considerable number of website requests, greatly reducing the load on the origin server(s).
Reverse proxies can operate whenever multiple web-servers must be accessible via a single public IP address. The web servers listen on different ports in the same machine, with the same local IP address or, possibly, on different machines and different local IP addresses altogether. The reverse proxy analyzes each incoming request and delivers it to the right server within the local area network.
The Forward Proxy
When people talk about a proxy server (often simply known as a “proxy”), more often than not they are referring to a forward proxy. Let me explain what this particular server does.
A forward proxy provides proxy services to a client or a group of clients. Oftentimes, these clients belong to a common internal network like the one shown below.
When one of these clients makes a connection attempt to that file transfer server on the Internet, its requests have to pass through the forward proxy first.
Depending on the forward proxy’s settings, a request can be allowed or denied. If allowed, then the request is forwarded to the firewall and then to the file transfer server. From the point of view of the file transfer server, it is the proxy server that issued the request, not the client. So when the server responds, it addresses its response to the proxy.
But then when the forward proxy receives the response, it recognizes it as a response to the request that went through earlier. And so it in turn sends that response to the client that made the request.
Because proxy servers can keep track of requests, responses, their sources and their destinations, different clients can send out various requests to different servers through the forward proxy and the proxy will intermediate for all of them. Again, some requests will be allowed, while some will be denied.
As you can see, the proxy can serve as a single point of access and control, making it easier for you to enforce security policies. A forward proxy is typically used in tandem with a firewall to enhance an internal network’s security by controlling traffic originating from clients in the internal network that are directed at hosts on the Internet. Thus, from a security standpoint, a forward proxy is primarily aimed at enforcing security on client computers in your internal network.
But then client computers aren’t always the only ones you find in your internal network. Sometimes, you also have servers. And when those servers have to provide services to external clients (e.g. field staff who need to access files from your FTP server), a more appropriate solution would be a reverse proxy.
The Reverse Proxy
As its name implies, a reverse proxy does the exact opposite of what a forward proxy does. While a forward proxy proxies in behalf of clients (or requesting hosts), a reverse proxy proxies in behalf of servers. A reverse proxy accepts requests from external clients on behalf of servers stationed behind it just like what the figure below illustrates.
To the client in our example, it is the reverse proxy that is providing file transfer services. The client is oblivious to the file transfer servers behind the proxy, which are actually providing those services. In effect, whereas a forward proxy hides the identities of clients, a reverse proxy hides the identities of servers.
An Internet-based attacker would therefore find it considerably more difficult to acquire data found in those file transfer servers than if he wouldn’t have had to deal with a reverse proxy.
Just like forward proxy servers, reverse proxies also provide a single point of access and control. You typically set it up to work alongside one or two firewalls to control traffic and requests directed to your internal servers.
Both types of proxy servers relay requests and responses between source and destination machines. But in the case of reverse proxy servers, client requests that go through them normally originate from the Internet, while, in the case of forward proxies, client requests normally come from the internal network behind them.
A proxy server is computer that functions as an intermediary between a web browser (such as Internet Explorer) and the Internet. Proxy servers help improve web performance by storing a copy of frequently used webpages. When a browser requests a webpage stored in the proxy server’s collection (its cache), it is provided by the proxy server, which is faster than going to the web. Proxy servers also help improve security by filtering out some web content and malicious software.
Proxy servers are used mostly by networks in organizations and companies. Typically, people connecting to the Internet from home will not use a proxy server.
1. Obscure Client IP
2. Block Malicious Traffic
3. Block Sites (whitelists/blacklists)(categories of sites)
4. Log activity (user activity reports)
5. Improve Performance (caching the pages)
——————————– :::Types of Proxies:::
1. Forward Proxies
2. Open Proxies
3. Reverse Proxies
——————————–
In an enterprise that uses the Internet, a proxy server is a server that acts as an intermediary between a workstation user and the Internet so that the enterprise can ensure security, administrative control, and caching service. A proxy server is associated with or part of a gateway server that separates the enterprise network from the outside network and a firewall server that protects the enterprise network from outside intrusion.
A proxy server receives a request for an Internet service (such as a Web page request) from a user. If it passes filtering requirements, the proxy server, assuming it is also a cache server , looks in its local cache of previously downloaded Web pages. If it finds the page, it returns it to the user without needing to forward the request to the Internet. If the page is not in the cache, the proxy server, acting as a client on behalf of the user, uses one of its own IP addresses to request the page from the server out on the Internet. When the page is returned, the proxy server relates it to the original request and forwards it on to the user.
To the user, the proxy server is invisible; all Internet requests and returned responses appear to be directly with the addressed Internet server. (The proxy is not quite invisible; its IP address has to be specified as a configuration option to the browser or other protocol program.)
An advantage of a proxy server is that its cache can serve all users. If one or more Internet sites are frequently requested, these are likely to be in the proxy’s cache, which will improve user response time. In fact, there are special servers called cache servers. A proxy can also do logging.
The functions of proxy, firewall, and caching can be in separate server programs or combined in a single package. Different server programs can be in different computers. For example, a proxy server may in the same machine with a firewall server or it may be on a separate server and forward requests through the firewall.
——————————– :::Transparent versus non-transparent proxying:::
Issue
Smoothwall web proxy service can be configured to operate in either transparent or non-transparent mode – but what are the differences, and how should you choose between them?
Resolution
In transparent mode, there are no special configuration steps needed to setup client browsers, thus allowing the proxy service to be activated and in-use almost immediately. Once activated, all traffic destined for the Internet arriving on port 80 is automatically redirected through the proxy. With the latest Guardian products you can even use NTLM with Active Directory in conjunction with transparent proxying allowing for single sign on and minimal network configuration.
Both transparent and non-transparent proxying can be used together at the same time. Enabling transparent does not stop non-transparent from working. In situations where transparent is the norm but a specific application requires non-transparent you can simply configure the proxy settings in that application.
Both modes have pros and cons – if you would like to use transparent proxying please contact support for a discussion on the issues your network may experience when using this method.
Why use non-transparent proxying?
The main reason to use a non-transparent proxy is so that the web browser and other client applications know that a proxy is being used, and so can act accordingly. Initial configuration of a non-transparent proxy might be trickier, but ultimately provides a much more powerful and flexible proxying service. Another advantage of non-transparent proxying is that spyware and worms that use the web for transmission may not be able to function because they don’t know the proxy settings. This can reduce the spread of malicious software and prevent bandwidth from being wasted by infected systems.
Configuring proxy settings in non-transparent mode
When using non-transparent proxying, appropriate proxy settings must be configured on client machines and browsers. This can be achieved in a number of different ways:
Manually – Proxy settings can be entered manually in most web browsers and web-enabled applications. Usually such settings are entered as part of the applications Connection Settings or similar. The address of the proxy is required, along with the proxy port number. These settings are displayed on the “Services / web proxy” and “Guardian / web proxy” pages as part of the “Automatic configuration scrip”” region.
Automatic configuration script – The Smoothwall proxy provides a proxy.pac file that can be used to automatically configure proxy settings in most Internet browsers. To use the automatic configuration script, enter the URL displayed in the “Automatic configuration script” region of the “Services / web proxy” and “Guardian / web proxy” pages into your browser software.
Microsoft Windows 2000 domain – In a Windows 2000+ domain, proxy settings can be configured in the domain security policy. This eliminates the need to manually configure any part of the users system.
Automatic discovery – Many browsers support automatic discovery of proxy settings using the WPAD (Web Proxy Auto-Discovery) protocol. This is relatively easy to configure if you have a local DNS server. Using DHCP to distrubute proxy settings – DHCP can also be used to set proxy settings. That might be a better method than using security policies. Currently the DHCP server on the Smoothwall firewalls cannot be used for giving out proxy.pac locations.
Microsoft Windows login script – The Windows login script can be used to import a registry file which will automatically configure the system wide proxy settings.
.ini files – Browsers like Firefox can be configured automatically with ini files. Such files could be copied or modified as part of the login script on a Microsoft Windows or Linux network.
Third party solutions – Third party applications are available for Windows which can, at login, automatically configure web browser proxy settings. These range from simple programs designed specifically to automate proxy configuration, or more sophisticated applications that provide a range of services such as monitoring the users desktop.
When to use transparent proxying
When minimal or no network configuration is required. Transparent proxying can be useful in mixed environments containing Unix, Linux, Apple Mac and Microsoft Windows systems. This allows quick access to the web proxy for everyone, without having to configure a multitude of different platform specific applications and browsers. If transparent proxy is required, please have a talk with Smoothwall support before you decide on the implementation as there are a lot of caveats using this method.
——————————————– How to Setup a Proxy
Most internet browsers can be setup to run through proxies in just a matter of minutes.
Internet Explorer Proxy Settings
Click Tools
Click Internet Options
Click the Connections Tab
Click LAN settings
Check the “Use a proxy server for your LAN” box
Enter the IP Address of the Proxy Server and the Port Number
Click OK
Go to WhatIsMyIP.com to check for proxy
FireFox Proxy Settings
Click the FireFox Button(The button in the upper left corner)
Click Options
Click Options in the new tab
Click the Advanced Tab
Click Settings
Click Manual Proxy Settings
In the HTTP Proxy Box enter the IP Address of the proxy server and the Port number
Click OK
Go to WhatIsMyIP.com to check for proxy
Google Chrome Proxy Settings
Click the Customize and Control Button(Button with the wrench picture in upper right corner
Click Under the Hood
Click Change proxy settings
Click LAN Settings
Check the “Use a proxy server for your LAN” box
Enter the IP Address of the Proxy Server and the Port Number
Click OK
Go to WhatIsMyIP.com to check for proxy
Safari Proxy Settings
Click Safari
Click Preferences
Click Advanced
Click Change Settings
Check the Web Proxy(HTTP) box
Enter the IP Address of the Proxy Server and the Port Number
Click Apply Now
Go to WhatIsMyIP.com to check for proxy
Port forwarding or port mapping is a name given to the combined technique of
1.translating the address or port number of a packet to a new destination
2.possibly accepting such packet(s) in a packet filter (firewall)
3.forwarding the packet according to the routing table.
The destination may be a predetermined network port (assuming protocols like TCP and UDP, though the process is not limited to these) on a host within a NAT-masqueraded, typically private network, based on the port number on which it was received at the gateway from the originating host.
The technique is used to permit communications by external hosts with services provided within a private local area network
Port forwarding allows remote computers (for example, computers on the Internet) to connect to a specific computer or service within a private local-area network (LAN).
In a typical residential network, nodes obtain Internet access through a DSL or cable modem connected to a router or network address translator (NAT/NAPT). Hosts on the private network are connected to an Ethernet switch or communicate via a wireless LAN. The NAT device’s external interface is configured with a public IP address. The computers behind the router, on the other hand, are invisible to hosts on the Internet as they each communicate only with a private IP address.
When configuring port forwarding, the network administrator sets aside one port number on the gateway for the exclusive use of communicating with a service in the private network, located on a specific host. External hosts must know this port number and the address of the gateway to communicate with the network-internal service. Often, the port numbers of well-known Internet services, such as port number 80 for web services (HTTP), are used in port forwarding, so that common Internet services may be implemented on hosts within private networks.
Typical applications include the following:
Running a public HTTP server within a private LAN
Permitting Secure Shell access to a host on the private LAN from the Internet
Permitting FTP access to a host on a private LAN from the Internet
Administrators configure port forwarding in the gateway’s operating system. In Linux kernels, this is achieved by packet filter rules in the iptables or netfilter kernel components. BSD and Mac OS X operating systems implement it in the Ipfirewall (ipfw) module.
When a port forward is implemented by a proxy process , then no packets are actually translated, only data is proxied. This usually results in the source address (and port number) being changed to that of the proxy machine.
———————————————
Port forwarding opens certain ports on your home or small business network, usually blocked from access by your router, to the Internet. Opening specific ports can allow games, servers, BitTorrent clients, and other applications to work through the usual security of your router that otherwise does not permit connections to these ports.
———————————————-
If you are running servers inside your network, which are going to be accessed from the outside world, you have to use port forwarding on your router.
Within the router it forwards certain ports to specific servers.
If you have a webserver and you want to access it from outside the local network, you will have to port forward port 80.
e.g: email server, web server, ftp server etc.
you can only port forward a single port for a single public IP to the single IP to that port inside the network.
e.g: 2.2.2.2:80 port forwarded to 192.168.1.10:80, but if you are using another web server then you will have to you another port
e.g. SMB router
sometimes the common services are already mentioned and you simply have to mention the destination IP (e.g. FTP 21->21 to IP 10.1.10.20)
 One of the interesting things about GNS3 is that you can connect your topology to the real world. For some of your CCNA and CCNP studies you may need to run an actual Web browser or Cisco’s Security Device Manager (SDM) among others. Just connect your topology to your real PC. You could even connect to virtual machines running on your computer inside VMware or Virtual PC. I’ve even set up two copies of Windows XP Professional running inside VMware virtual machines. Then, I ran Cisco soft IP Phones that could talk to each other. You could connect your virtual network to a real network as well. Connecting a virtual topology running within GNS3 to real devices is very exciting, but again, your throughput is going to be limited compared to using real equipment for the entire topology. It only makes sense to use GNS3 in a lab environment and for learning purposes.
 Drag a Cloud into your workspace. Right-click the Cloud and chooseConfigure. Click on C1 under Clouds, but choose the NIO Ethernet tab.Administrator rights are required (root account under Linux).


 Client side:
 Data formatting: (-f argument)


