Here’s the most expected tutorial from Learn2Crack, and today we are going to show how to install Android KitKat 4.4 on your PC. To install the latest Android Kitkat on Pc Visit this link.
Features of Android 4.4:
1) Support for Restricted Profiles
2) OpenGL ES 3.0 for High-Performance Graphics
3) Bluetooth Smart Ready support
4) Notification Access
1.Install VirtualBox on your PC
2.Open VirtualBox and select New. In the dialog box enter the name as your wish and
select i)Type : Linux
ii)Version : Other Linux
and select Next
3.In the next dialog box enter the memory size as your wish
Note : Minimum 1 GB required for KitKat
and select Next.
4.In the next dialog box select create a virtual hard drive now. Then select VDI and select fixed or dynamically allocated as your wish and create the virtual drive
Note : Mininimum 1 GB required for installation
5.Select Virtual device and select settings, a dialog box appears. In the dialog box select
i)Storage->Storage Tree->Empty
ii)In the attributes section select the Android 4.4 iso file you downloaded and check Live Cd/Dvd, then click Ok
6.Then start the virtual device. In the screen select Install Android-x86 to hard disk.
7.In the next screen select Create/Modify Partition.
8.Then create a new primary bootable partition and select write. After finishing writing select quit.
9.Then install android in sda1 and select type as ext3 , choose yes for installing grub.
10.After installing remove live iso from VirtualBox and reboot. Now you can boot into Android 4.4 .
A while back, Canonical released an experimental Ubuntu Touch emulator running Unity 8 and Mir. Back then, there were a few bugs, including a nasty one on 64bit that could break the system and since they were fixed, I though I’d write an article on how to properly install and use the Ubuntu Touch Emulator in Ubuntu 14.04, 13.10 and 12.04.
The initial Ubuntu Touch Emulator installation instructions changed so if you’ve installed the first experimental release, use the instructions below to create new instances.
Below you can watch two quick Ubuntu Touch Emulator test videos I’ve recoded in Ubuntu 14.04:
Ubuntu Touch Emulator is available in the official Ubuntu 14.04 repositories but it’s an old version and futhermore, it doesn’t support x86 instances, so I recommend using the Phablet Tools PPA, which has packages for Ubuntu 14.04, 13.10 and 12.04.
Add the Phablet Tools PPA and install the emulator using the following commands:
If you’ve installed an older version of Ubuntu Emulator, also run an upgrade:
sudo apt-get upgrade
The Ubuntu Emulator package is also available in the Ubuntu SDK PPA, but it’s an older version at the time I’m writing this article (about one month older than the one from the Phablet Tools PPA).
Note that I’ve only tested it in Ubuntu 14.04 and 12.04, but it should also work in Ubuntu 13.10 since the PPA above has packages for it.
Creating and running instances
1. The first thing you need to do is create a new instance – we’ll call it “UbuntuTouch” in the commands below:
The current “stable” image doesn’t seem to work, that’s why I’ve added the Utopic proposed channel for the image in the commands above.
On Ubuntu 12.04, you may get the following error:
Error while converting ~/.local/share/ubuntu-emulator/UbuntuTouch/system.img: Unknown option 'compat'
qemu-img: Invalid options for file format 'qcow2'.
I’m not sure why this error is displayed, but the emulator runs just fine so ignore it.
2. Then, run the new instance by using the following command:
ubuntu-emulator run UbuntuTouch
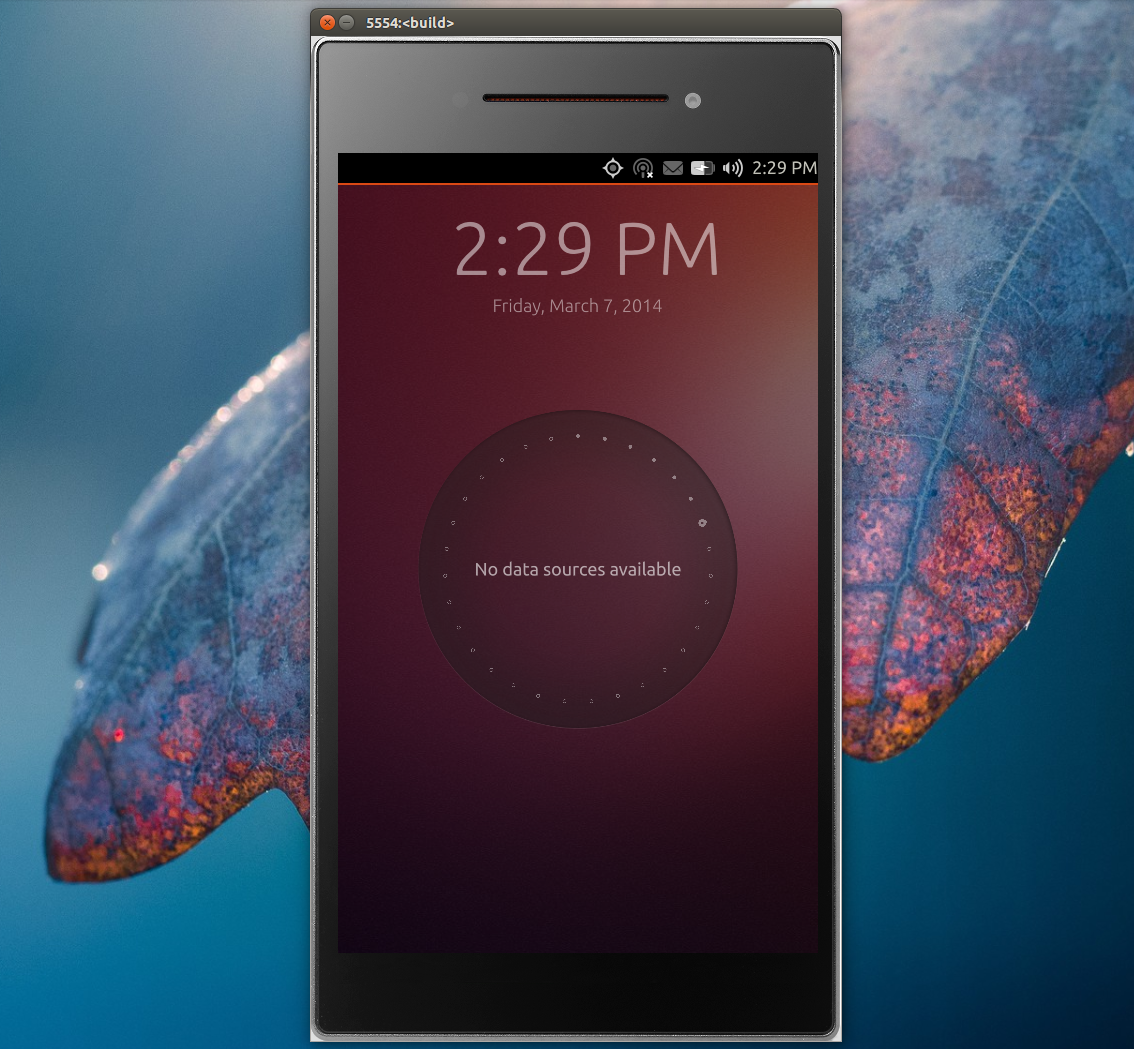
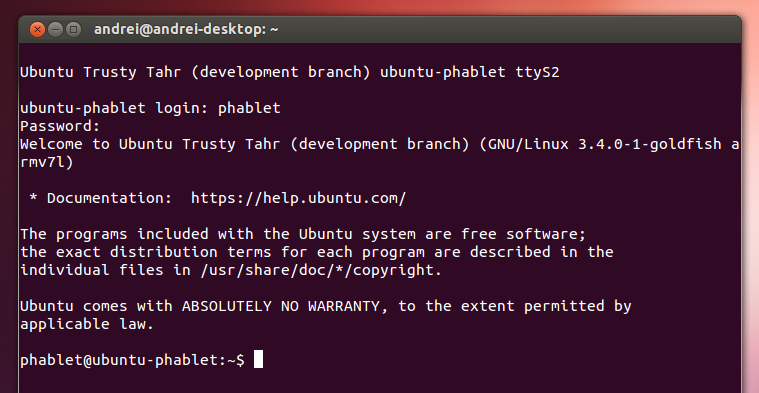
The first time you run the emulator, the boot process will take quite a while. When it finishes booting, a shell with Ubuntu Touch will start, asking you to enter the username and password:
If you want to interact with the emulator via an interactive ADB session, log in here using “phablet” (without the quotes) for both the username and password. It’s not required to log in here if you only want to use the Ubuntu Touch Emulator GUI.
After this, it might take another few minutes and Unity 8 with Mir should be loaded in the Ubuntu Touch Emulator.
In theory, Ubuntu Touch emulator should support some parameters, such as setting the memory (“–memory”), which by default is set to 512mb of RAM, but for some reason the instance doesn’t start when using this, or at least it didn’t in my test.
3. Optional: change the Ubuntu Touch Emulator size:
Ubuntu Touch Emulator with a 0.7 scale on my 1920×1080 monitor.
If the default Ubuntu Touch Emulator size is too big for your screen, you can scale it down. To do this, run it with the “–scale” option. For instance, to scale the emulator to half its original size, use:
ubuntu-emulator run --scale 0.5 UbuntuTouch
Notes:
the downloaded images are stored under ~/.cache/ubuntuimages
the images are stored under ~/.local/share/ubuntu-emulator
Deleting instances
To delete an Ubuntu Touch Emulator instance, use the following command:
sudo ubuntu-emulator destroy UbuntuTouch
Where “UbuntuTouch” is the name of the instance you’ve created. If you can’t remember the name, you can run the command below to list your Ubuntu Touch Emulator instances:
ubuntu-emulator list
Creating / restoring snapshots
Ubuntu Touch Emulator supports disk snapshots – to take a snapshot, use the following command:
It’s really very tough job for every System or Network administrator to monitor and debug Linux System Performance problems every day. After being a Linux Administrator for 5 years in IT industry, I came to know that how hard is to monitor and keep systems up and running. For this reason, we’ve compiled the list of Top 20 frequently used command line monitoring tools that might be useful for every Linux/Unix System Administrator. These commands are available under all flavors of Linux and can be useful to monitor and find the actual causes of performance problem. This list of commands shown here are very enough for you to pick the one that is suitable for your monitoring scenario.
1. Top – Linux Process Monitoring
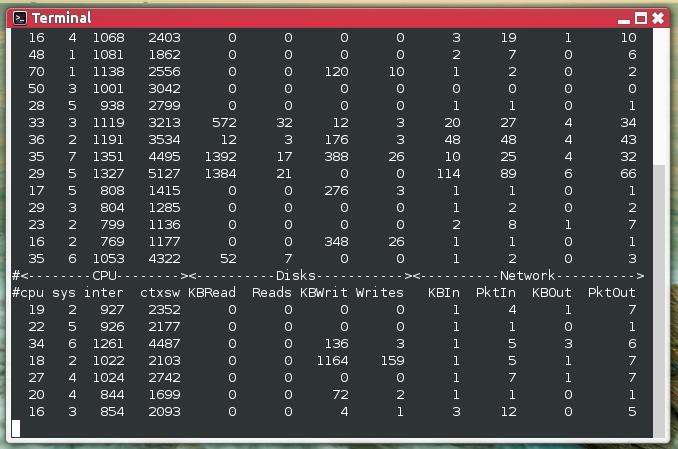
Linux Top command is a performance monitoring program which is used frequently by many system administrators to monitor Linux performance and it is available under many Linux/Unixlike operating systems. The top command used to dipslay all the running and active real-time processes in ordered list and updates it regularly. It display CPU usage, Memory usage, Swap Memory, Cache Size, Buffer Size, Process PID, User, Commands and much more. It also shows high memory and cpu utilization of a running processess. The top command is much userful for system administrator to monitor and take correct action when required. Let’s see top command in action.
Linux VmStat command used to display statistics of virtual memory, kernerl threads, disks,system processes, I/O blocks, interrupts, CPU activity and much more. By default vmstat command is not available under Linux systems you need to install a package called sysstat that includes a vmstat program. The common usage of command format is.
# vmstat

procs -----------memory---------- ---swap-- -----io---- --system-- -----cpu-----
 r  b   swpd   free  inact active   si   so    bi    bo   in   cs us sy id wa st
 1  0      0 810420  97380  70628    0    0   115     4   89   79  1  6 90  3  0
Lsof command used in many Linux/Unix like system that is used to display list of all the open files and the processes. The open files included are disk files, network sockets, pipes, devices andprocesses. One of the main reason for using this command is when a disk cannot be unmounted and displays the error that files are being used or opened. With this commmand you can easily identify which files are in use. The most common format for this command is.
# lsof

COMMAND     PID      USER   FD      TYPE     DEVICE     SIZE       NODE NAME
init          1      root  cwd       DIR      104,2     4096          2 /
init          1      root  rtd       DIR      104,2     4096          2 /
init          1      root  txt       REG      104,2    38652   17710339 /sbin/init
init          1      root  mem       REG      104,2   129900     196453 /lib/ld-2.5.so
init          1      root  mem       REG      104,2  1693812     196454 /lib/libc-2.5.so
init          1      root  mem       REG      104,2    20668     196479 /lib/libdl-2.5.so
init          1      root  mem       REG      104,2   245376     196419 /lib/libsepol.so.1
init          1      root  mem       REG      104,2    93508     196431 /lib/libselinux.so.1
init          1      root   10u     FIFO       0,17                 953 /dev/initctl
Tcpdump one of the most widely used command-line network packet analyzer or packets snifferprogram that is used capture or filter TCP/IP packets that received or transferred on a specific interface over a network. It also provides a option to save captured packages in a file for later analysis. tcpdump is almost available in all major Linux distributions.
# tcpdump -i eth0

tcpdump: verbose output suppressed, use -v or -vv for full protocol decode
listening on eth0, link-type EN10MB (Ethernet), capture size 96 bytes
22:08:59.617628 IP tecmint.com.ssh > 115.113.134.3.static-mumbai.vsnl.net.in.28472: P 2532133365:2532133481(116) ack 3561562349 win 9648
22:09:07.653466 IP tecmint.com.ssh > 115.113.134.3.static-mumbai.vsnl.net.in.28472: P 116:232(116) ack 1 win 9648
22:08:59.617916 IP 115.113.134.3.static-mumbai.vsnl.net.in.28472 > tecmint.com.ssh: . ack 116 win 64347
Netstat is a command line tool for monitoring incoming and outgoing network packets statistics as well as interface statistics. It is very useful tool for every system administrator to monitor network performance and troubleshoot network related problems.
Htop is a much advanced interactive and real time Linux process monitoring tool. This is much similar to Linux top command but it has some rich features like user friendly interface to manage process, shortcut keys, vertical and horizontal view of the processes and much more. Htop is a third party tool and doesn’t included in Linux systems, you need to install it using YUM package manager tool. For more information on installation read our article below.
Iotop is also much similar to top command and Htop program, but it has accounting function to monitor and display real time Disk I/O and processes. This tool is much useful for finding the exact process and high used disk read/writes of the processes.
IoStat is simple tool that will collect and show system input and output storage device statistics. This tool is often used to trace storage device performance issues including devices, local disks,remote disks such as NFS.
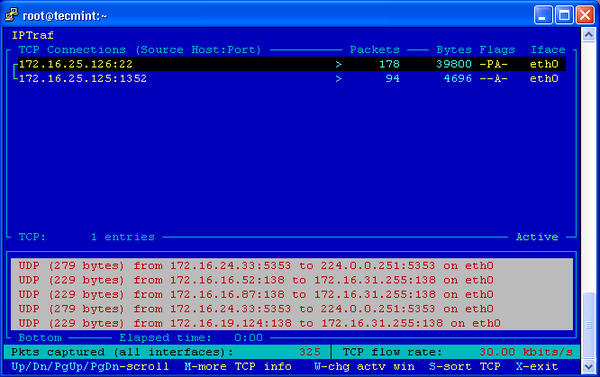
IPTraf is an open source console-based real time network (IP LAN) monitoring utility for Linux. It collects a variety of information such as IP traffic monitor that passes over the network, including TCP flag information, ICMP details, TCP/UDP traffic breakdowns, TCP connection packet and byne counts. It also gathers information of general and detaled interface statistics of TCP, UDP, IP, ICMP, non-IP, IP checksum errors, interface activity etc.
psacct or acct tools are very useful for monitoring each users activity on the system. Both daemons runs in the background and keeps a close watch on the overall activity of each user on the system and also what resources are being consumed by them.
These tools are very useful for system administrators to track each users activity like what they are doing, what commands they issued, how much resources are used by them, how long they are active on the system etc.
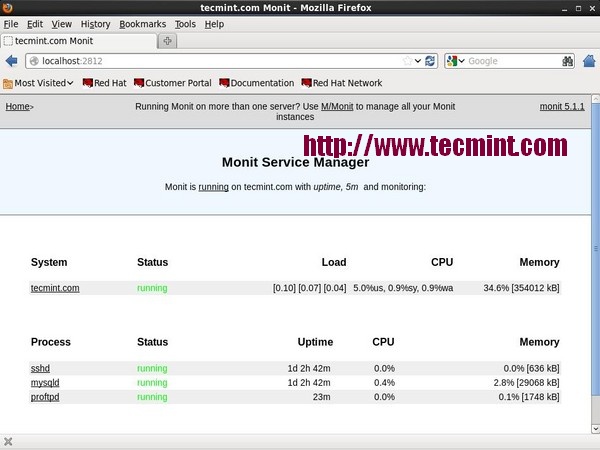
Monit is a free open source and web based process supervision utility that automatically monitors and managers system processes, programs, files, directories, permissions, checksums and filesystems.
It monitors services like Apache, MySQL, Mail, FTP, ProFTP, Nginx, SSH and so on. The system status can be viewed from the command line or using it own web interface.
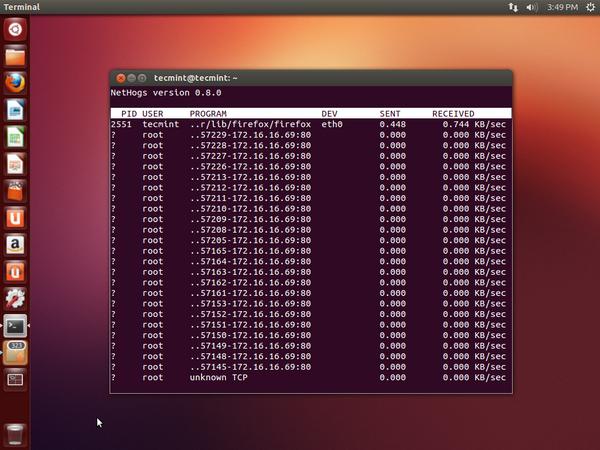
12. NetHogs – Monitor Per Process Network Bandwidth
NetHogs is an open source nice small program (similar to Linux top command) that keeps a tab on each process network activity on your system. It also keeps a track of real time network traffic bandwidth used by each program or application.
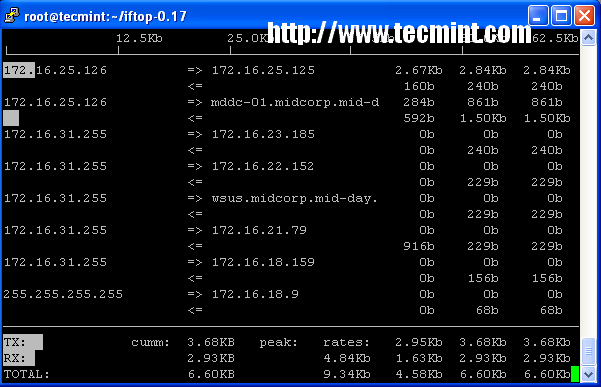
iftop is another terminal-based free open source system monitoring utility that displays a frequently updated list of network bandwidth utilization (source and destination hosts) that passing through the network interface on your system. iftop is considered for network usage, what ‘top‘ does for CPU usage. iftop is a ‘top‘ family tool that monitor a selected interface and displays a current bandwidth usage between two hosts.
Monitorix is a free lightweight utility that is designed to run and monitor system and network resources as many as possible in Linux/Unix servers. It has a built in HTTP web server that regularly collects system and network information and display them in graphs. It Monitorssystem load average and usage, memory allocation, disk driver health, system services, network ports, mail statistics (Sendmail, Postfix, Dovecot, etc), MySQL statistics and many more. It designed to monitor overall system performance and helps in detecting failures, bottlenecks, abnormal activities etc.
Arpwatch is a kind of program that is designed to monitor Address Resolution (MAC and IPaddress changes) of Ethernet network traffic on a Linux network. It continuously keeps watch on Ethernet traffic and produces a log of IP and MAC address pair changes along with a timestamps on a network. It also has a feature to send an email alerts to administrator, when a pairing added or changes. It is very useful in detecting ARP spoofing on a network.
Suricata is an high performance open source Network Security and Intrusion Detection andPrevention Monitoring System for Linux, FreeBSD and Windows.It was designed and owned by a non-profit foundation OISF (Open Information Security Foundation).
VnStat PHP a web based frontend application for most popular networking tool called “vnstat“.VnStat PHP monitors a network traffic usage in nicely graphical mode. It displays a total IN andOUT network traffic usage in hourly, daily, monthly and full summary report.
Nagios is an leading open source powerful monitoring system that enables network/system administrators to identify and resolve server related problems before they affect major business processes. With the Nagios system, administrators can able to monitor remote Linux, Windows, Switches, Routers and Printers on a single window. It shows critical warnings and indicates if something went wrong in your network/server which indirectly helps you to begin remediation processes before they occur.
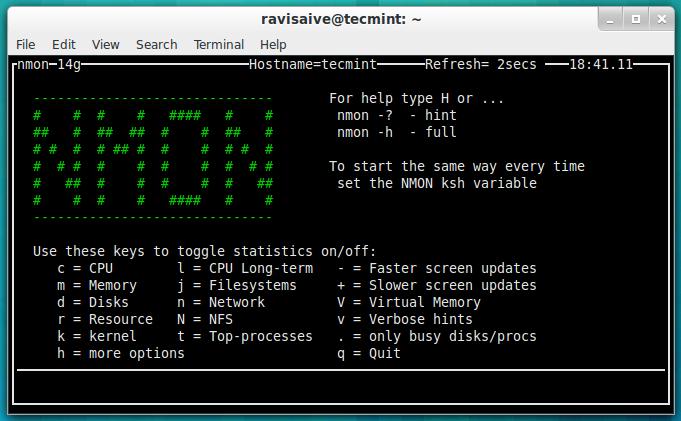
Nmon (stands for Nigel’s performance Monitor) tool, which is used to monitor all Linux resources such as CPU, Memory, Disk Usage, Network, Top processes, NFS, Kernel and much more. This tool comes in two modes: Online Mode and Capture Mode.
The Online Mode, is used for real-time monitoring and Capture Mode, is used to store the output in CSV format for later processing.
Collectl is a yet another powerful and feature rich command line based utility, that can be used to gather information about Linux system resources such as CPU usage, memory, network, inodes, processes, nfs, tcp, sockets and much more.
We would like to know what kind of monitoring programs you use to monitor performance of your Linux servers? If we’ve missed any important tool that you would like us to include in this list, please inform us via comments and please don’t forget to share it.
The day those of us on Linux could log into the world’s most popular video streaming service, and watch movies and TV shows without having to jump through hoops, has been long overdue.
Netflix do not currently provide, offer or support any “official” way to watch content from their service on Ubuntu, Fedora or any other desktop Linux distribution. Subscribers have to use a supported platform, like Windows, Chrome OS or Android, or wrestle with a Wine-based workaround, the successes of which can vary from person to person.
Until now, that is.
Why It Works Now: DRM
It’s now possible to stream video content from Netflix on a Linux desktop natively in recent development builds of Google Chrome. How?
Earlier this year the web standards body the ‘World Wide Web Consortium’ (commonly known as the W3C) controversially pushed forward with plans to introduce support for protected content (‘DRM’) through HTML5 Video through the Encrypted Media Extension specification.
Google describes EME as “a JavaScript API that enables web applications to interact with DRM systems, in order to allow playback of encrypted media.” This works without the need to hand off to or make use of bloated third-party plugins like Silverlight or Adobe Flash.
Back in June Netflix announced support for HTML5 video playback on Windows 8.1 and Safari (Yosemite only) using EME. With Google being one of the chief backers of this plugin-free DRM approach, Chrome natively supports EME.
Put two and two together and you get…showtime!
By spoofing the user agent of an official supported EME platform (e.g., Windows 8.1) in Chrome for Linux we can get fuss-free totally native playback of movies and TV shows — for now, at least.
And while few of us like ‘Digital Rights/Restrictions Management’, most of us have come to accept that until the entertainment conglomerates devout in their pursuit of its use move with the times, we don’t have an awful lot of leeway. We have the choice to push back in choosing more open alternatives, but until then we can at least commit begrudgingly.
How To Watch Netflix on Linux
‘It’s not quite as easy as opening Netflix and hitting play, but it is easier than adding PPAs’
For Google Chrome users on Ubuntu this means you can, albeit with a little bit of extra tweaking, get Netflix video to play on Linux. No plugins, PPAs, no glasses of Wine needed. It’s not quite as easy as opening Netflix and hitting play, but it is easier than adding PPAs to download and configure boatloads of Windows dependencies, muddying up your install.
On to the part you came here for: how to get it working. The steps that follow are not as complex or as numerous as they appear at first glance. I’m simply walking you through each part by hand.
Prerequisites:
Ubuntu 14.04 LTS* or 14.10 Alpha
Google Chrome Beta or Dev (v37+)
An active Netflix subscription or trial
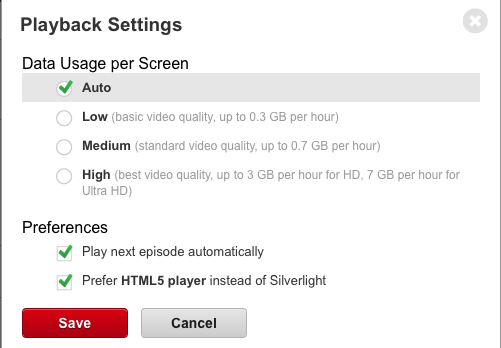
Have ‘Prefer HTML5‘ selected in ‘Netflix Account > Playback’
Get Chrome
As discovered by Nathan VanCamp on Google+ (via Phoronix) we can use User Agent String spoofing to fool Netflix into using EME-based playback on Linux.
The process doesn’t work first time for everyone who tries it, with some still seeing ‘Install Silverlight’ prompts, or ‘Aww, Snap!’ screens. Your own milage may vary.
So, first steps: you need to use Chrome Beta or Dev. Don’t stamp your feet, or try this in a stable build; you have to use the latest beta or dev build of Google Chrome for Linux for this to work.
Getting Google Chrome for Linux on either channel (in both 32-bit and 64-bit) is simple enough: just grab the appropriate installer from the links below. Note: this will upgrade your existing stable installation.
Download the appropriate zip archive from those linked above, extract it, then move the three .deb files inside to your home folder. Open a new Terminal window and enter the following command:
sudo dpkg -i libnss3*
User Agent Extension
With everything ready the last step is to modify the user-agent string of the browser to pretend we’re accessing Netflix from a platform it likes.
Modifying the UA string can be done in a number of ways but the easiest way is to install the free User-Agent Switcher Extension from the Chrome Web Store:
Installing this will place new icon in the right of the Chrome toolbar. Right-click on this item and select ‘Options’. We’ll now add the required HTTP agent with the following string (thanks to Mat Enders for these steps):
Name: Netflix Linux
String: Mozilla/5.0 (Windows NT 6.3; Win64; x64) AppleWebKit/537.36 (KHTML, like Gecko) Chrome/38.0.2114.2 Safari/537.36
Group: (is filled in automatically)
Append?: Select ‘Replace’
Flag: IE
If you fill this in correctly you should have something like this:
Click the ‘Add’ button at the far end to save your UA.
Now, load ‘netflix.com‘ in a new tab, and click the User-Agent Switcher toolbar icon, click ‘Chrome’ and select the ‘Netflix Linux’ entry. This will reload the page.
Optionally, you can set a permanent spoof rule to force this user-agent to take effect when loading Netflix:
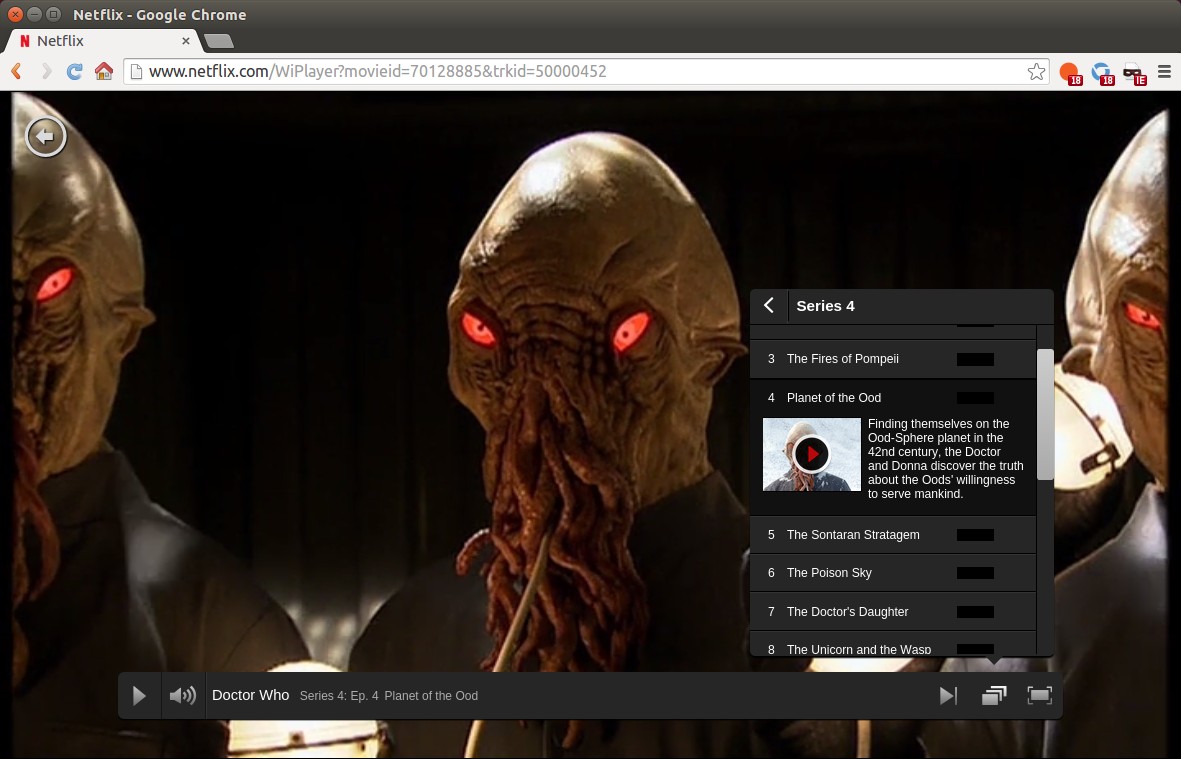
Following that, you should be able to go to Netflix and begin playing your favourite films or TV shows.
With the new UA in effect simply load up a video and…